
You know what’s cool? It’s when our clients share an idea for something they'd like to see in the app, and then it becomes a new product feature.
You can now view issue category counts just like you can view issue category scores…but with one key difference. Your category issue counts are included in your Google Analytics report.
To get started, make sure you have the Google Analytics 4 connector set up. If you don’t, you can find instructions in the help document titled Connecting Google Analytics 4 (GA4). It takes under a minute to set up, and brings your GA4 data right to your DubBot Site Dashboard.
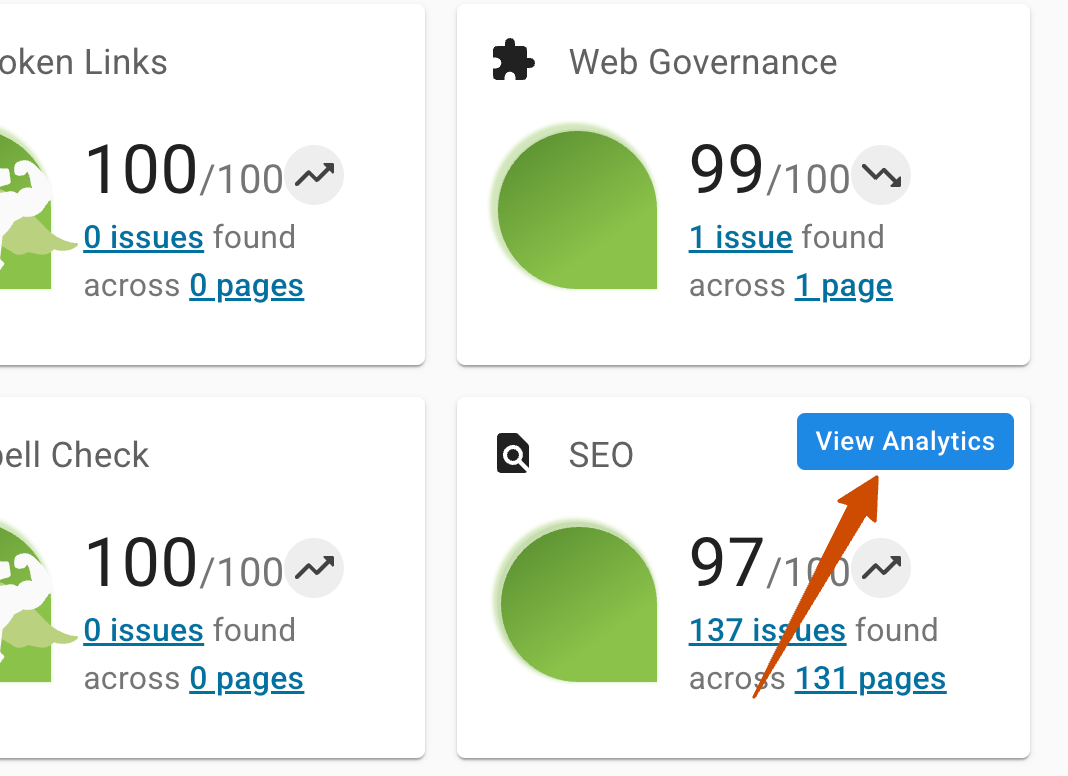
Once you have completed the GA4 connector set-up, navigate to your Site Dashboard and select View Analytics from the SEO panel.
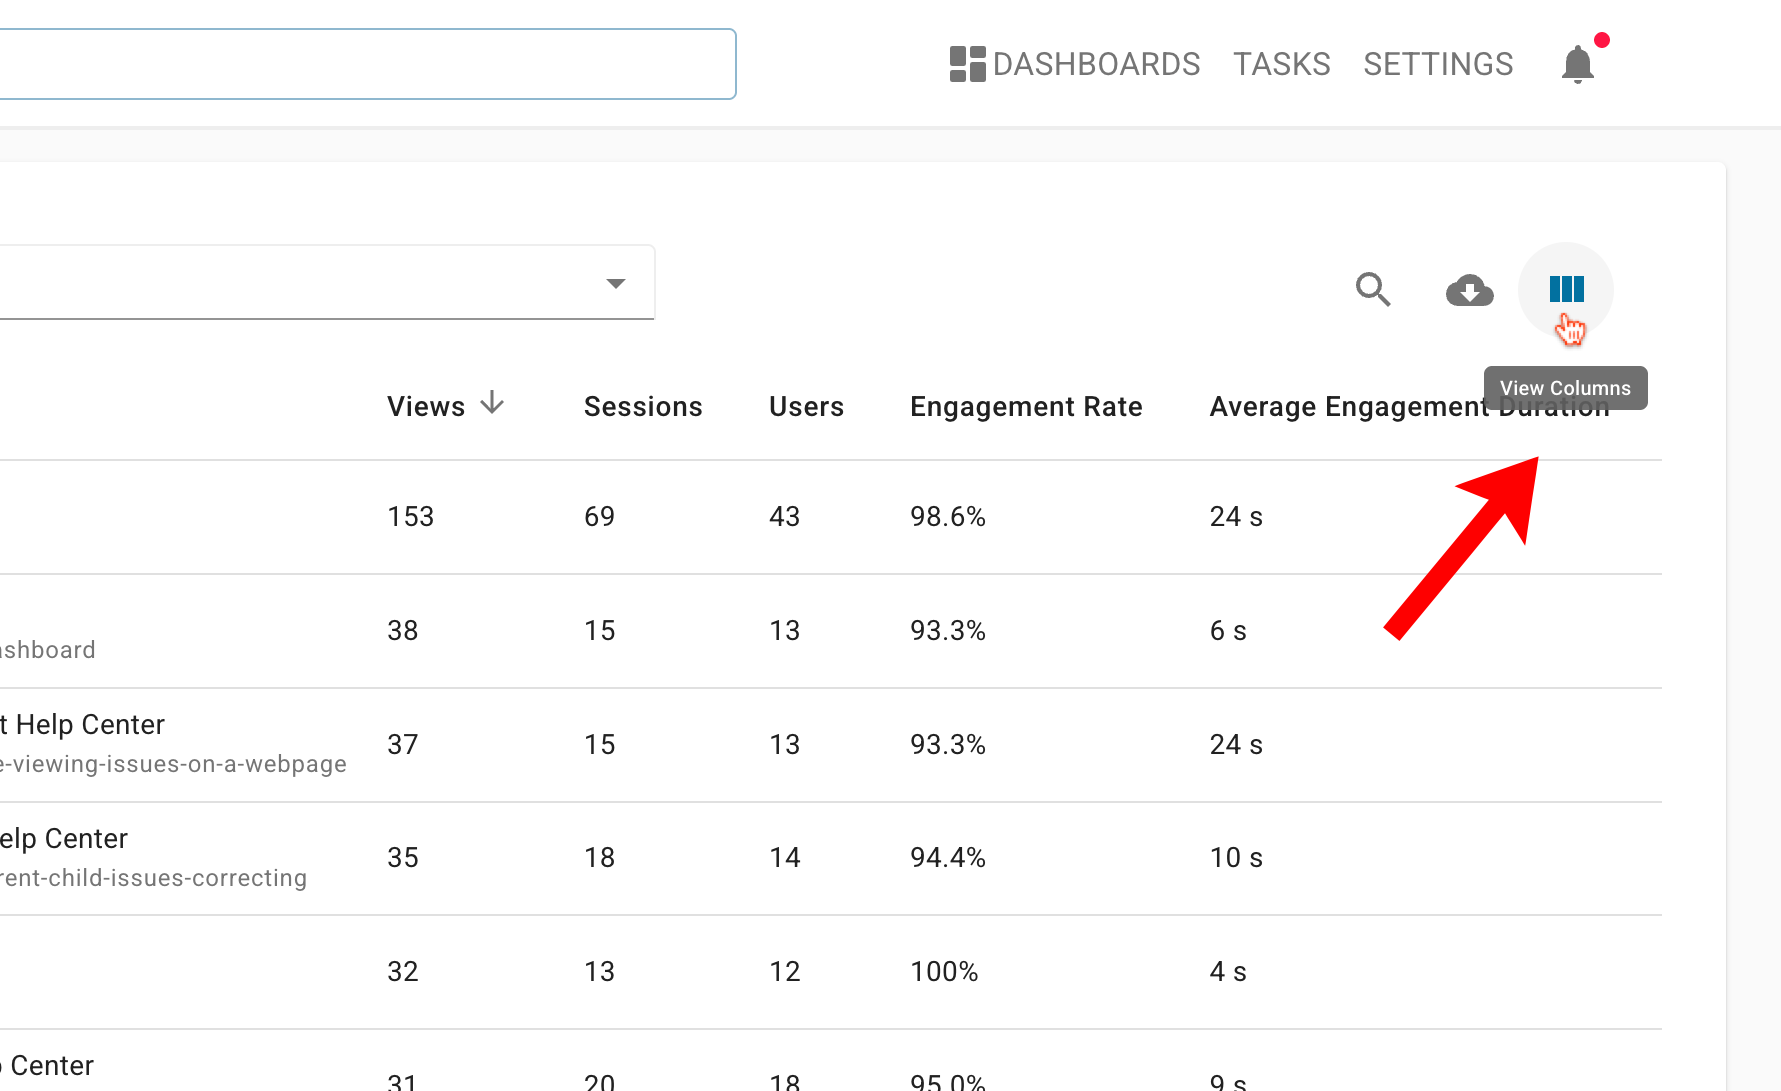
From your Account Dashboard, select the View Columns icon.
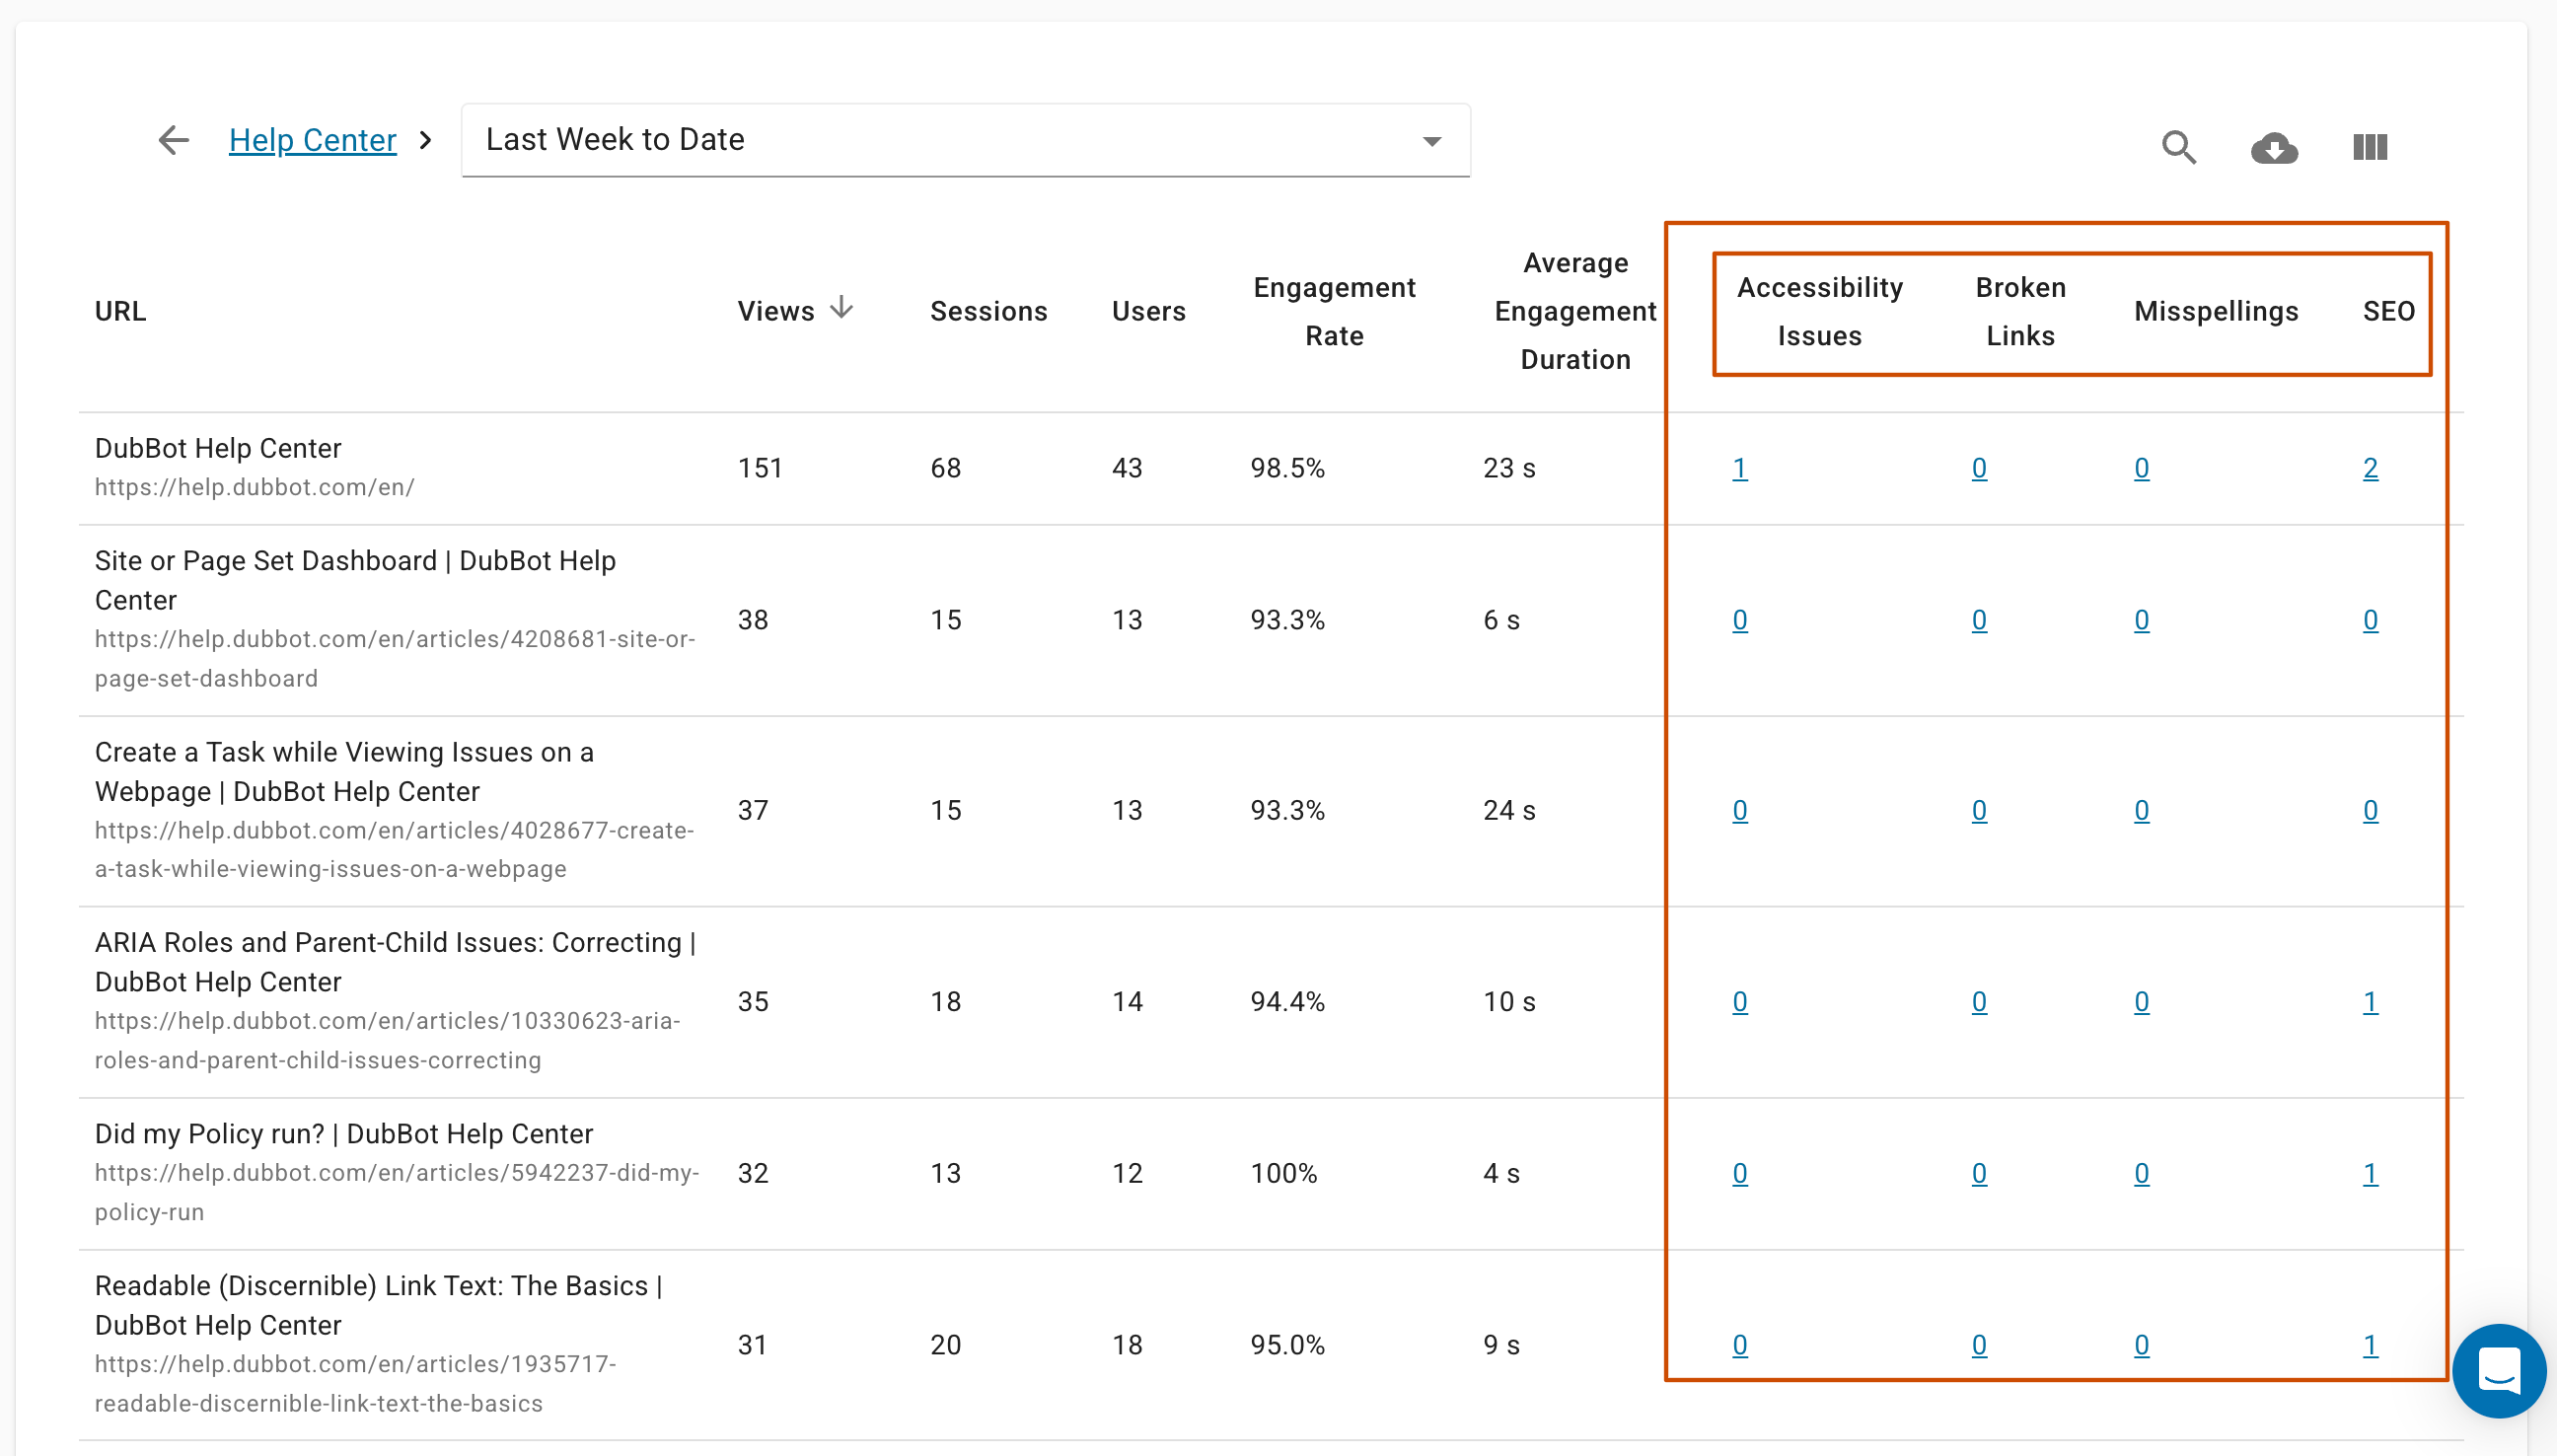
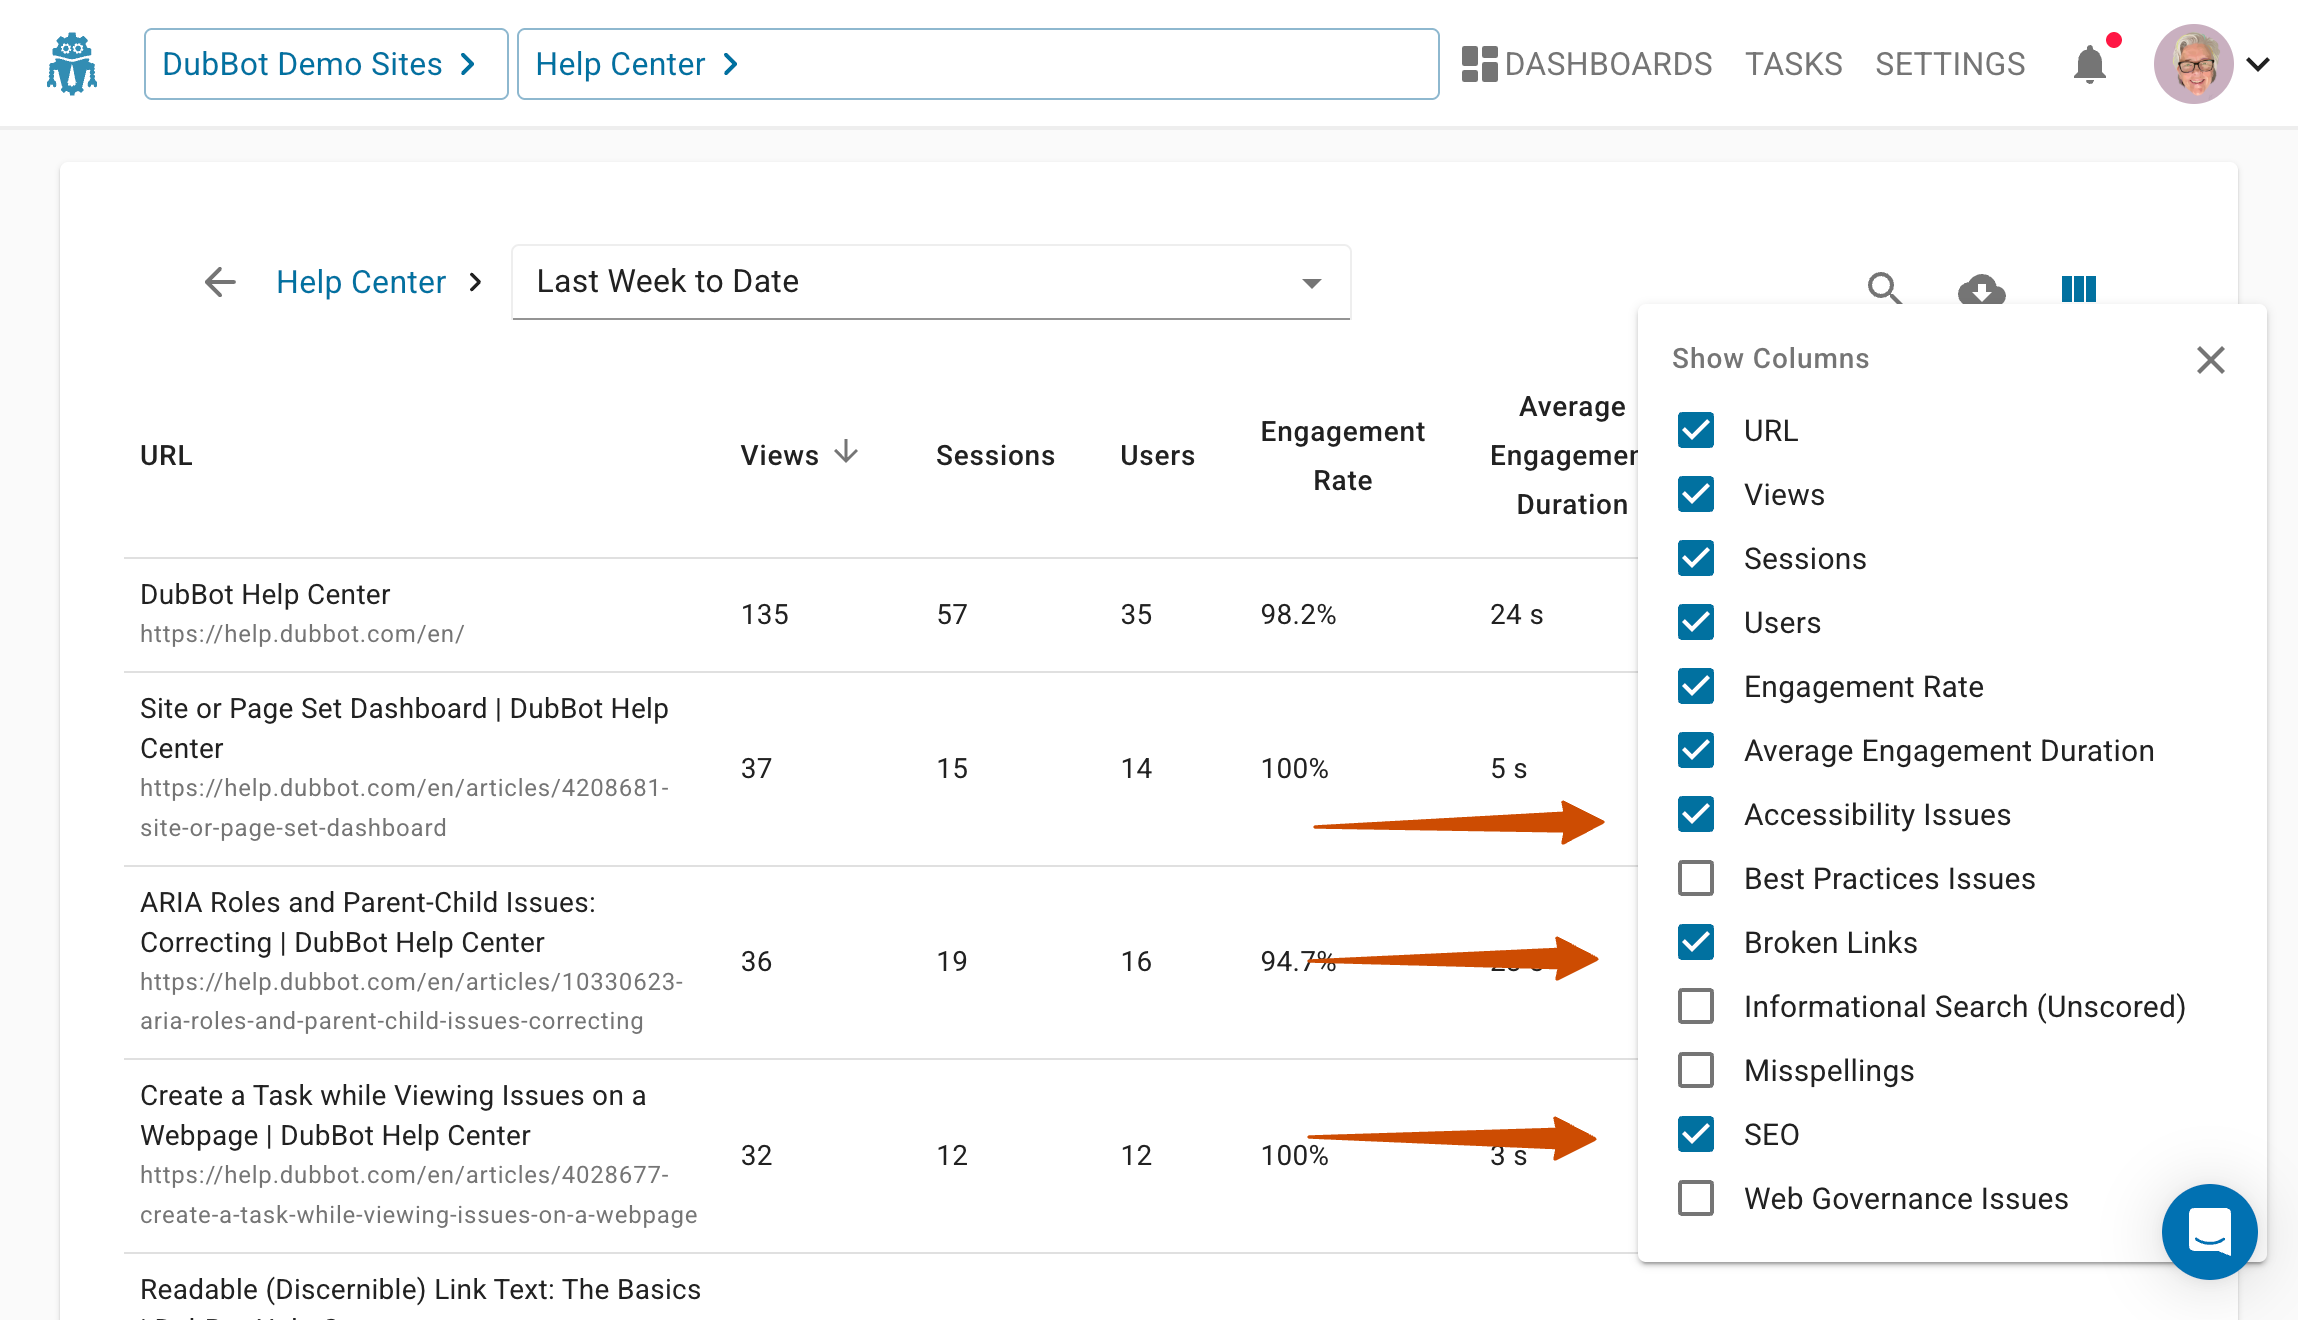
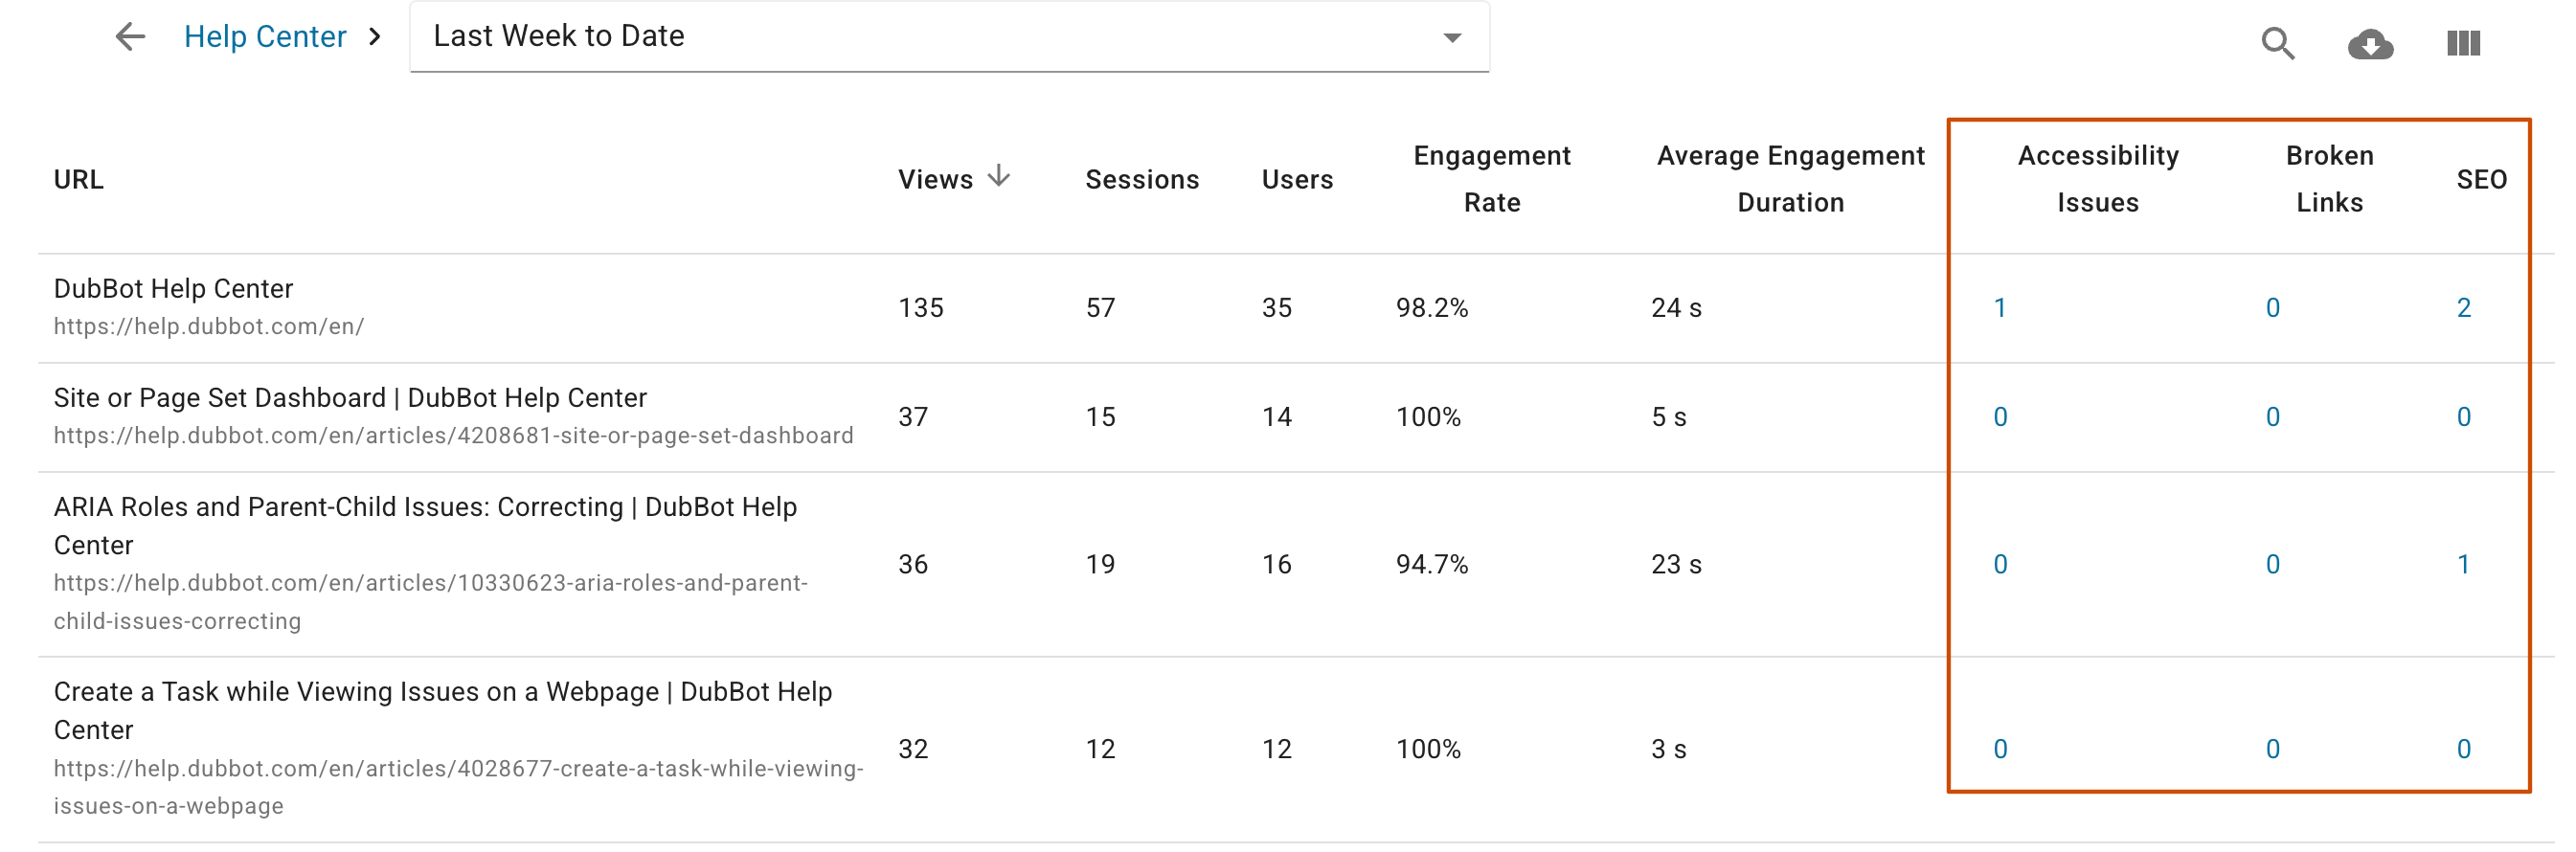
Then select which category score you would like to add. Every category tested for your account is available: Accessibility Issues, Best Practices Issues, Broken Links, Informational Search, Misspellings, SEO, and Web Governance Issues.
In this example, I have chosen to add the Accessibility Issues, Broken Links, and SEO. The counts appear to the right of the Average Engagement Duration metric. Pretty great, uh?
Our clients don’t just use DubBot—they help shape it. Every day, their insights guide us to refine, reimagine, and build features that make a real difference.
A human author creates the DubBlog posts. The AI tool Gemini is sometimes used to brainstorm subject ideas, generate blog post outlines, and rephrase certain portions of the content. Our marketing team carefully reviews all final drafts for accuracy and authenticity. The opinions and perspectives expressed remain the sole responsibility of the human author.
